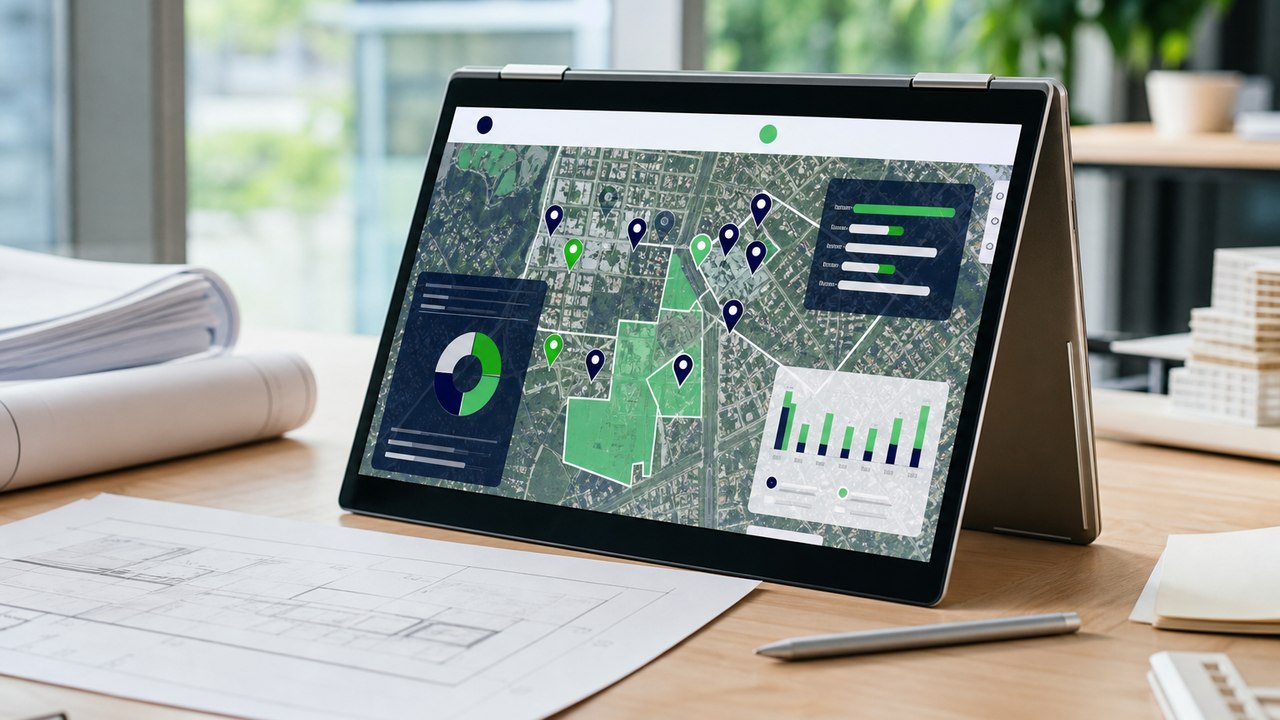
Mapvina handles the spatial layer: cleaning and locating addresses, calculating distance or travel time, building routes, and delivering results through maps and APIs. The DMS remains the system of record for customer profiles, orders, activities, and KPIs. Sales representatives and managers still decide which customers to prioritize, what visit frequency is appropriate, and which exceptions to accept. Only when these three parts connect properly can a business reduce road time without sacrificing retailer relationships.
In traditional distribution, a small store can be a place of purchase and display, a source of retailer feedback on pricing, and a link that helps a brand understand how a neighborhood is changing. Research on marketing channels in Vietnam notes the significant role of traditional channels and distributors’ delivery capabilities in the distribution structure.[2] A sales route therefore cannot be reduced to finding the shortest path through a list of pins on a map.
A productive visit must happen while the store is operating, reach the right person, allow enough service time, and have a specific objective: take an order, check inventory, execute a display, resolve a complaint, or maintain the relationship. If a route is packed too tightly, a representative may reach every location but have only superficial conversations. If every decision is left to personal memory, the team may favor familiar stores while neglecting new or remote ones. Research on tour planning for field sales forces likewise shows that the problem must combine the selection of worthwhile customers with working-hour limits, mandatory visits, and long-term relationships; the level of detail available for each location also depends on the data at hand.[4]
The right operational question is therefore not “What is the shortest route?” It is: given today’s available time, who needs a visit, within what time window, by which representative, for how many service minutes, and in what sequence can the team accomplish the most business objectives while keeping the workload realistic?
A beat plan often starts with a supervisor’s experience: divide customers by district, assign several wards to each representative, then designate Monday for Area A and Tuesday for Area B. This works when there are few outlets and the team is stable. Once the network reaches thousands of locations, four small errors begin to compound.
“Market X, near the rear gate,” an old street name, a reversed house number, or one address shared by several stalls can place a pin incorrectly. A ward-based assignment that looks right on paper may still be wrong for the actual access route.
Customer A is visited twice every week because “that’s how we have always done it,” while a promising new outlet that needs support receives only one visit a month. The schedule no longer reflects current objectives.
Two points that look close on screen may be separated by a river, one-way street, median strip, or market entrance. Geometric distance does not represent actual travel time.
A closed outlet or a retailer who changes an appointment leaves the representative to improvise. The DMS sees only a missing check-in, while the manager cannot tell which customer should be inserted or whether the revised route will break an afternoon commitment.
Another management error is treating visit count as synonymous with effectiveness. A representative can achieve 100% schedule completion through very short visits, meeting the wrong person, or checking in near the store. When a KPI rewards quantity alone, the system encourages people to satisfy the metric rather than serve the market.
To repair a beat plan, a business must separate four decisions that are often collapsed into one schedule.
| Decision layer | Question to answer | Adjustment cycle | Output |
|---|---|---|---|
| Assigned territory | Which outlets belong to which representative or distributor? | Quarterly or when the network changes substantially | Outlet list and boundaries of responsibility |
| Visit frequency | How many times should each outlet be visited in a cycle? | Monthly/quarterly, with campaign exceptions | For example: twice a week, once a week, or twice a month |
| Weekly schedule | Which visits go on which days to maintain a steady cadence? | Before the workweek | Visits by day and time window |
| Daily route | What is the actual sequence, expected arrival time, and capacity for inserting exceptions? | Daily, with replanning when needed | Stop sequence, ETA, distance, and workload |
Research on multi-period service territory design describes this relationship directly: partitioning customers, scheduling visits across multiple periods, and creating each day’s route; frequency, service duration, and continuity of the assigned representative all matter.[3] If a business optimizes only the daily route while territory and frequency remain poorly designed, the algorithm merely helps representatives complete the wrong list faster.
Suppose An Phu Distribution Company has 28 field sales representatives serving 3,600 outlets in a central city and adjacent districts. The company uses a DMS to store customer records, orders, inventory observed at the outlet, and check-ins. Its beat plan is prepared monthly in a spreadsheet and then imported back into the DMS.
The illustrative baseline for the latest four weeks is 10.2 planned visits per representative per day; 7.4 are checked in; 5.8 reach the right person or complete the required task; and the recorded median distance is 46 km/day. About 18% of priority outlets miss their required frequency for at least one cycle. Management is not aiming to “reduce headcount.” The pilot objective is to use existing working time better, increase productive visits, and make the reasons for missed routes transparent.
Mapvina receives outlet data and operating constraints through the integration layer, processes addresses, applies geocoding and—when needed to cross-check a location—reverse geocoding, calculates distance/time matrices, and plans routes using Routing or VRP–Logistics. According to its public capability description, Mapvina provides a Map API and location services including Search, Geocoding, Routing, Distance, and VRP–Logistics for integration into enterprise systems.[1] Route results return to the DMS or sales application as a stop list, visit sequence, estimated arrival times, and route geometry for map display.
There is no need to wait for a perfect “data lake.” A pilot can start with six data groups, provided that each field has an owner and an error-correction rule.
| Data group | Minimum fields | Quality control | Purpose |
|---|---|---|---|
| Outlet | Unique ID, name, raw address, phone number, operating status | Detect duplicate IDs/phone numbers, blank addresses, and closed customers | Create a reliable outlet master |
| Location | Latitude, longitude, confidence, source, and update date | Flag out-of-area coordinates, pins at ward centroids, and multiple outlets sharing coordinates | Routing, Distance Matrix, and map display |
| Visit demand | A/B/C tier, frequency, latest visit date, overdue visits | Versioned tiering rules with an approver | Select mandatory and deferrable visits |
| Service window | Opening hours, owner availability, days closed, expected duration | Periodic confirmation by sales; record seasonal exceptions | Constrain time windows and daily workload |
| Sales representative | Employee ID, territory, shift, start/end points, capability/category | Synchronize leave and territory changes | Assignment and workload balancing |
| Execution history | Arrival/departure times, check-in coordinates, visit result, order, failure reason | Standardize reason codes and retain server timestamps | Measure KPIs and calibrate service durations |
Address normalization comes before geocoding: parse and correct recognizable components, retain the original address for traceability, then return coordinates with a confidence level. Low-confidence results need a review queue where representatives or data administrators can confirm them on a map. Reverse geocoding is useful when coordinates from an actual check-in suggest that an old pin may be wrong; it supplies a reference address for comparison and should not automatically overwrite the customer record without human approval.
Most importantly, do not confuse “has coordinates” with “has correct coordinates.” If hundreds of outlets share a ward centroid because geocoding was not sufficiently precise, the computed route may be technically valid yet useless on the road. The data dashboard should show the proportion of geocodes meeting the confidence threshold, suspected duplicates, and locations not verified recently.
An outlet’s tier determines visit resources, so using one month of sales as the sole criterion creates distortion. Low sales may reflect frequent stockouts, inadequate service, or a recent opening. Conversely, a customer who orders reliably by phone may no longer need visits as often as before.
In the illustrative case, An Phu uses a 100-point scorecard: sales and margin contribution, 35 points; area/category potential, 20; display role or local influence, 15; service need and churn risk, 15; payment compliance, 10; and campaign objectives, 5. These weights are only examples and must be agreed by Sales, Trade Marketing, and Finance. A manager may move an outlet up or down one tier only with a reason, an expiry date, and approval.
Strategic outlets or those requiring intensive service. Illustrative example: two visits per week, one of which must reach the decision-maker. A missed appointment enters the priority queue.
Outlets with stable contribution or clear potential. Example: one visit per week, movable within a one-day margin if no time-window commitment is broken.
Outlets maintained for coverage or awaiting reassessment. Example: two visits per month, combined with calls or remote ordering if the business model allows.
These should have a separate status for their first 4–8 weeks rather than being forced into A/B/C. Their initial frequency supports discovery of needs and does not reflect historical sales.
A customer tier answers “What service level do we want?” It does not automatically set the schedule. Team capacity remains a constraint. If total service and travel time exceeds available working hours, the system must flag the capacity shortfall or identify visits that must be deferred; it should not silently compress visit duration to an unrealistic number.
Nightly or event-driven, the DMS sends outlet IDs, addresses, status, tiers, visit history, related orders, and assigned representatives by API or batch. The integration layer rejects records without IDs; errors are logged rather than disappearing silently.
Mapvina processes addresses and returns coordinates. High-confidence locations enter the route-planning flow; doubtful results appear in a map review queue. A data steward reviews cases such as “near the market,” new addresses, or coordinates far outside the territory. Verified coordinates are written back to the DMS with their source and update date.
Managers view outlets on a map and use distance and travel time to assess assigned clusters. The Distance Matrix compares travel costs across many representative–outlet pairs or clusters instead of relying on radius. A regional manager must approve any proposed territory reallocation because it affects relationships and representatives’ income.
The DMS or orchestration service creates visits from frequency, last-visit date, campaigns, and appointments. Representatives have a window to propose changes: the owner is available only Wednesday afternoon, an outlet is under renovation, or the customer asks for the supervisor to attend. The approver sees both the reason and the capacity impact.
VRP–Logistics receives the visit list, time windows, service durations, shifts, start/end points, and mandatory constraints. Its output assigns work to each representative by day. Routing then creates the sequence and path; the Distance Matrix supports travel-time calculations between locations at scale. If a request cannot be scheduled, the system returns an “infeasible” status and reason rather than dropping it automatically.
Each location shows the visit objective, time window, expected duration, relationship notes, and ETA. The representative sees both a list and a map, with controls to call the outlet and navigate. Any change after the cutoff must leave an audit trail: who changed it, when, and why.
Check-in records the server time, coordinates, GPS accuracy, and business result. When an exception occurs, the app sends its status to dispatch; the remaining route is recalculated if needed while appointments that may not slip remain locked. The representative sees the revised plan before accepting it.
The DMS receives visit results, orders, and failure reasons. Mapvina provides the spatial plan and actual route for comparison. Instead of asking only “Why were two stops missed?”, the manager determines whether the cause was data, the store, dispatch, traffic, or representative behavior. Each category calls for a different action.
Responsible optimization means the system must clearly state what cannot fit within the available time—instead of producing an attractive schedule and leaving the representative to absorb what is impossible.
The representative selects a reason code, captures evidence if policy requires it, and records when a return might be possible. Using the time matrix, the system checks nearby backup stops, prioritizing customers that are due and fit the time window. A backup stop is inserted only if it will not delay a locked appointment. The closed visit moves to a queue; after repeated closures, master-data administration verifies the operating status and opening hours.
If the appointment moves to later that day, the uncompleted part of the route is recalculated. If it moves to another day, the DMS retains the visit requirement and frequency deadline; the manager sees the new day’s workload before approval. The system should not mark a representative as having “missed the route” when a customer-requested change was recorded through the proper process.
For example, a Tier A outlet reports a stockout risk or needs a complaint resolved. The supervisor assigns a priority, duration, and resolution deadline. The tool tests insertion into each suitable representative’s route and shows which visits would be affected and the new ETA. The manager decides the trade-off; Mapvina calculates the location and routing impact but does not decide commercial value in place of people.
The general principle is to maintain an “exception budget”: for example, leave part of daily capacity open or set a limit on replanning frequency. If every message triggers optimization, the schedule will change constantly and representatives will lose trust. Confirmed appointments should be locked; flexible visits form the adjustment zone.
The DMS remains the business system of record: customer profiles, approved customer tiers, orders, receivables where applicable, KPIs, activity history, and permissions. Mapvina is the location-services and route-optimization layer. The sales application may remain part of the existing DMS; maps, route results, and ETAs can be embedded or called through APIs. This separation avoids creating two competing sources of truth.
| Integration point | Data sent to Mapvina | Result returned | Responsible role |
|---|---|---|---|
| Outlet onboarding/update | ID, original address, area, status | Normalized address, coordinates, confidence | Data steward reviews doubtful records |
| Weekly planning | Visit demand, frequency, windows, durations, representatives, shifts | Daily assignment, infeasible visits, expected workload | Sales Ops prepares; regional manager approves |
| Daily route publication | Approved list, start/end points, locked stops | Visit sequence, ETA, distance, route geometry | Supervisor publishes; representative executes |
| Same-day exception | Actual status, cancelled/inserted stops, remaining time | Alternative route and impact on locked schedule | Representative reports; supervisor approves major exceptions |
| Reconciliation | Check-ins and business results | Spatial plan-versus-actual comparison | Sales Ops and regional manager |
APIs need idempotency so retries do not duplicate schedules, versioning for every route, consistent timestamps, and clear error codes. If connectivity is lost, the application must retain the latest published route and save tasks offline. A routing API interruption should never make the entire day’s customer list disappear.
The Sales Director sets service objectives, priority thresholds, and trade-offs among coverage, sales, and travel cost. Regional Managers approve territories, weekly schedules, and exceptions that affect customer relationships. Sales Operations manages data, runs planning, monitors capacity, and analyzes deviations. Sales representatives verify field information, execute the schedule, record outcomes accurately, and propose exceptions. IT/DMS manages integration, identity, permissions, logging, and resilience. The data steward resolves doubtful addresses or coordinates. Mapvina provides map/location services and supports integration within the solution’s scope; it does not replace the company’s business approval roles.
The management dashboard should have three levels. The data level shows the proportion of outlets with qualifying coordinates, duplicates, and locations not verified recently. The planning level shows visits due, schedulability, workload by representative, and expected distance and time. The execution level tracks on-window visits, productive visits, kilometer/minute deviations from plan, failure reasons, and outlets overdue for their required frequency.
On the map, managers need filters for territory, representative, customer tier, and status. A good dashboard, however, should not become a screen that tracks a red dot minute by minute. Its purpose is to identify structural operating problems, not to create a sense that employees are being continuously monitored beyond legitimate work needs.
| KPI | Illustrative baseline | Illustrative pilot target | Measurement and notes |
|---|---|---|---|
| Productive visits/representative/day | 5.8 | 6.7–7.2 | Valid check-in plus completed task/right person reached; a check-in alone does not count |
| Km per productive visit | 7.9 km | Reduce by 10–15% | Actual-route GPS distance divided by productive visits; compare like territory types and workdays |
| Priority customers served at required frequency | 82% | ≥92% | A/B outlets completing required visits in the cycle divided by all outlets due, excluding verified closures |
| On-window arrival rate | Not yet measured consistently | Establish baseline in weeks 1–2; improve by 10 percentage points | Server timestamp compared with the confirmed time window |
| Feasible-plan rate | Not available | ≥95% | Visits scheduled without exceeding shifts/windows; unscheduled visits must carry a reason |
| Manager scheduling time/week | 6 hours | ≤3.5 hours | Time log from data cutoff to publication; separate data-correction time |
| Outlets meeting the geocode standard | 74% | ≥95% in the pilot area | Based on the agreed confidence threshold and a field-validation sample |
The measurement design should include a pilot group and a control group comparable in outlet density, tier mix, and travel conditions. Run the baseline for at least two to four weeks, then the pilot for four to six weeks, to avoid drawing conclusions from one promotional week or unusual weather. Compare results per representative/day and by territory type; use the median alongside the mean so a few extreme days do not distort the result.
Do not attribute all order growth to routing. Orders are also affected by price, inventory, trade programs, seasonality, and sales capability. The evidence closest to Mapvina is spatial and operational: kilometers, travel time, feasibility, on-window performance, and coverage at the required frequency. Sales and order-conversion outcomes should be monitored, but analyzed alongside other business factors.
Cost is not limited to API calls. A business must account for cleaning the master and verifying coordinates; DMS/app integration; configuring constraints and maps; change management; training for representatives, supervisors, and dispatchers; devices/mobile data if needed; operational support; quality monitoring; and fees for maps, geocoding, Routing, Distance Matrix, or VRP–Logistics under the agreed commercial arrangement. A universal budget would be inappropriate because cost depends on outlet count, calculation volume, data quality, integration depth, and SLA requirements.
Do not use one rigid radius everywhere. Store GPS accuracy, allow controlled alternative evidence, and distinguish “insufficient signal” from “not near the outlet.” Device location is only one signal in reconciliation.
Controls may examine server timestamps, impossible travel speeds, mocked locations, visit duration, and business-event trails. Excessive control, however, creates backlash. Policies should be transparent, explanations allowed, and disciplinary conclusions should not rely on a single location signal.
Reallocating territories or changing account ownership can damage relationships built over years. The algorithm should preserve selected representative–customer pairs as constraints, support a handover, and make changes only when the benefit is sufficient. Service-provider continuity is also emphasized in research on periodic service territory design.[3]
A route packed minute by minute cannot absorb rain, waiting for a retailer, or a conversation that runs long. Add buffers by outlet and territory type, limit the number of locked appointments, and assess interaction quality. “More stops” does not automatically mean “better selling.”
Collect location only as needed for work; clearly define when the app records it, who can view it, how long it is retained, and how it may be used. Restrict access by role, log queries, protect tokens/API keys, and establish a process for data-related requests. Legal and HR teams should review internal policy in the company’s context.
The application must cache the published route, allow offline task completion, and synchronize later. The integration layer should use controlled retries, idempotency, timeouts, alerts, and a last-known-route fallback. For weekly plans, keep an approved snapshot so operations can continue temporarily if the service is unavailable.
Select a pilot area with 4–6 representatives and about 400–700 outlets—an illustrative scale, not a fixed recommendation. Finalize the definition of a productive visit, frequencies, exception reason codes, and KPIs. Audit the master, normalize/geocode addresses, and field-sample doubtful coordinates. Map the DMS–Mapvina flow, permissions, and offline approach. Collect a baseline without yet changing routing practices so the current data can be understood.
Generate proposed schedules with Distance Matrix, Routing, and VRP–Logistics, but have managers compare them with the old schedule. Record every managerial route edit and its reason: customer relationship, market hours, road restrictions, appointment, or bad data. Repeated reasons must become data fields or constraints rather than remaining in the planner’s head. From the third week of this phase, publish the new routes to part of the pilot team, with a daily support channel.
Roll out to the full pilot group and activate the exception workflow and dashboard. Compare with a similar group and review KPIs both weekly and across the full period. Interview a sample of representatives and outlet owners to identify side effects the dashboard cannot show. A pilot committee comprising Sales, Sales Ops, IT, and regional management decides whether to scale, refine further, or stop. Conditions for scaling should include coordinate quality meeting the threshold, stable integration, improved operational KPIs, and no deterioration in customer-relationship quality.
Not when the map displays more attractive colored lines. A better route is one that representatives believe they can execute, managers can explain customer by customer, outlets receive the promised service, and end-of-day data feeds back into better planning. It must also absorb exceptions without causing the entire schedule to collapse.
Mapvina creates value where spreadsheets and personal experience are difficult to scale: turning addresses into usable locations, calculating realistic travel costs across many points, building constrained route options, and delivering the results into enterprise products through maps and APIs.[1] The DMS retains the business workflow. People retain authority over commercial decisions and relationships. That is the practical structure for moving a beat plan from an assignment sheet to a verifiable visit operating system.
Select one territory, one sales team, and a set of KPIs that can be measured over 90 days. Mapvina can work with Sales Ops and IT to review address data, DMS integration points, route constraints, and the measurement design before scaling.
Verification note: This is a hypothetical case used to illustrate a method. “An Phu Distribution Company,” the team size, outlet count, baseline, KPI targets, A/B/C weights, pilot scale, and timeline do not represent an actual Mapvina customer or result. Information about Mapvina’s capabilities and research findings is used only within the scope of the sources below. Businesses should reconfirm features, technical limits, commercial terms, legal requirements, and integration feasibility at the time of implementation.
Moving this industry forward requires not only skill, talent and expertise, but also imagination. All are welcome.